Next up in our series of posts digging into how you can improve your Core Web Vitals, we’re going to cover LCP or Largest Contentful Paint.
First, of course, in order to resolve any LCP issues you’re having you need to understand something important: what is LCP? LCP is the measurement metric that Google uses to evaluate how long it takes for the largest above-the-fold element to load on a webpage. This means that when you first load a website, this metric assesses how long the largest element on the visible part of the page (in other words the part that’s “above the fold”) takes to load.
You may be wondering if certain elements are considered in the LCP score and you’d be correct. LCP considers elements such as:
- Images
- Video thumbnails
- Background images added with CSS
- Text elements
So, in practice, it’s most of the things that make up a website. This means we need to consider each aspect of our website when dealing with LCP issues to ensure we get as good a score as possible. So, without further ado, let’s start our journey into LCP.
LCP and user experience
Before getting into the methods we can use to improve our LCP or how to measure it on any website, let’s take a step back and consider the UX implications if we don’t think about our LCP.
It’s no secret that users (including website makers like you and me) want fast, responsive websites that load quickly. We especially don’t want to sit and look at a blank screen while waiting for content to load. This is why Google recommends a maximum of 2.5 seconds for a good LCP score. Really, the closer to 0 you can get, the better.

But, why is this important? If a website takes too long to load, the odds are that impatient visitors will push the back button and find another website that fulfills their needs. So, not only will a bad LCP score annoy your users, but it’ll also potentially impact your website traffic, and consequently your bottom line, along with your SEO.
Build the most performant websites
Join other developers on the leading edge of development and subscribe to get monthly insights on creating websites that are performant and deliver maximum business value.
Measuring LCP
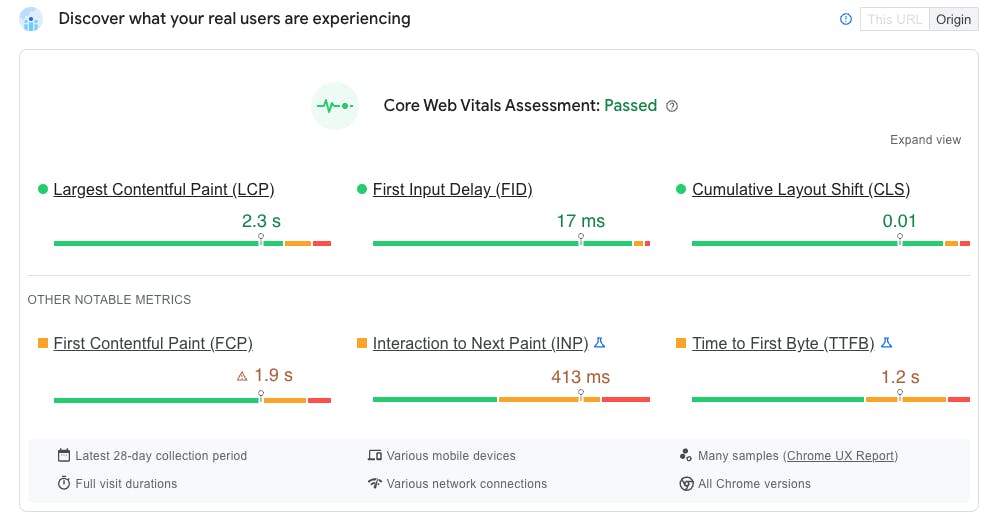
If you want to improve your LCP, you need to know your starting point. But, don’t worry you don’t need to break out a stopwatch and start manually timing elements loading onto a page because not only would that be incredibly tedious and annoying to do, it would be wildly inaccurate. Google has made a couple of tools to allow us to easily measure our Core Web Vitals, including LCP, on a website. These tools are PageSpeed Insights and the Chrome DevTools which includes a Lighthouse auditing tab.
Below are the steps you’ll need to measure your website’s LCP with both tools.
Lighthouse via Chrome DevTools
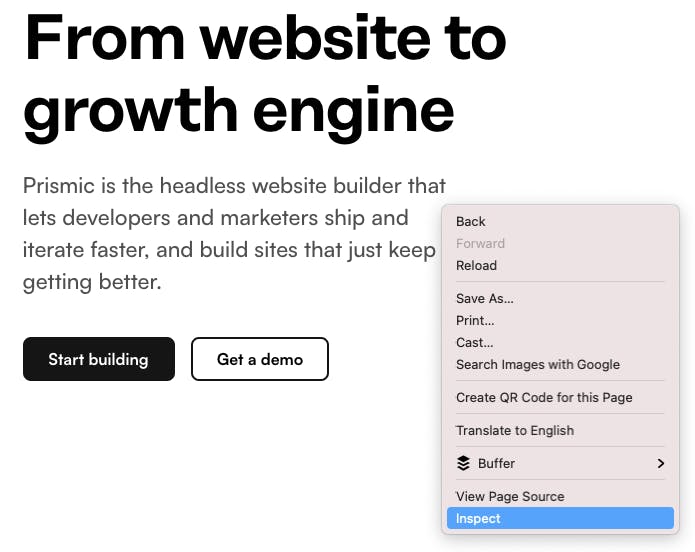
In Chrome, open up the page you want to inspect, then right-click and select “Inspect.”
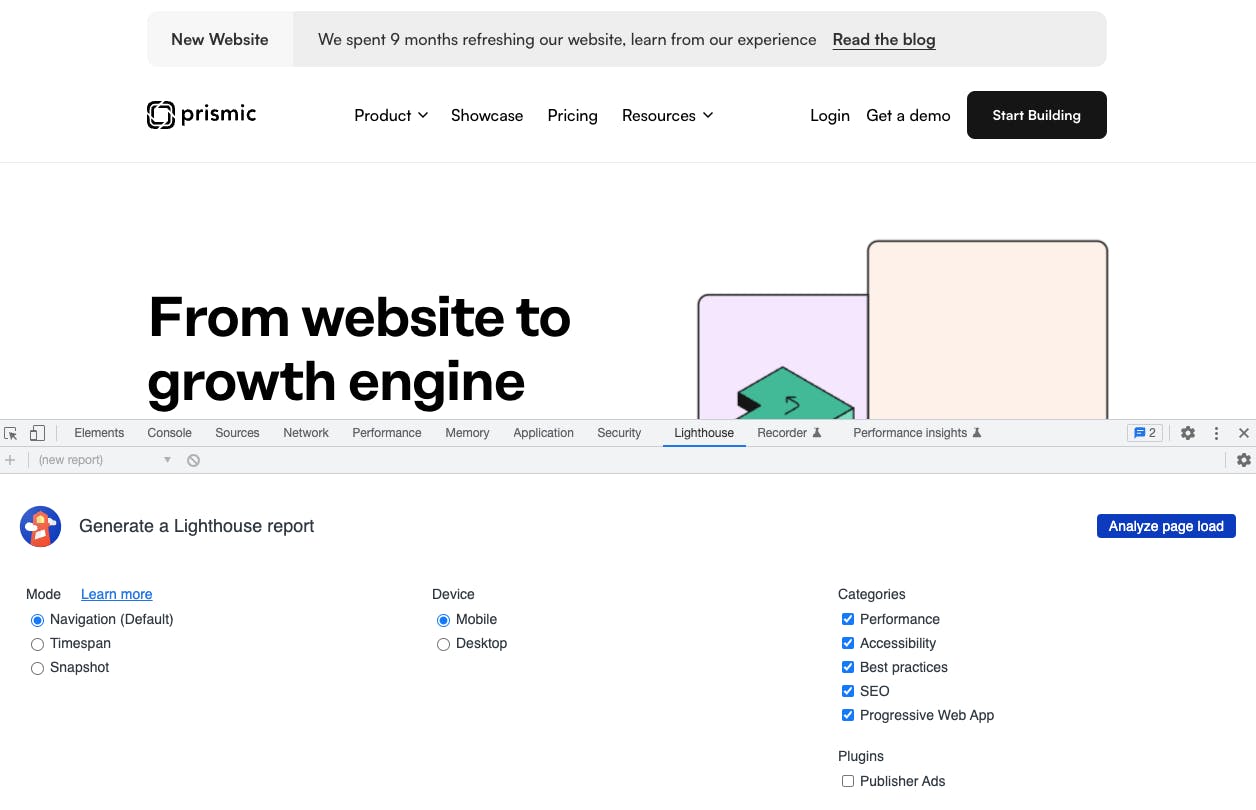
A new pane will open at the bottom or side of your browser window. In that pane, select the “Lighthouse” option (it may be under the “>>” symbol), and then click “Analyze page load.”
Once the report is generated, you can scroll down to the “Metrics” section to see your LCP. The “Opportunities” and “Diagnostics” sections will offer specific tips to improve your page’s overall performance.
PageSpeed Insights
Head over to PageSpeed, enter the URL of the page you want to check, and press “Analyze.” Similar to the “Metrics” section in Lighthouse, you’ll see your metrics in the first visible panel, as well as more diagnostics and recommendations further down the page.
What’s the difference between Lighthouse and PageSpeed?
Wondering which tool you should reach for? This blog post goes into more depth on each tool, explaining how they gather data for the results, what each tool offers, and when one might make sense over the other.
Common LCP issues to watch out for
Now, before looking at how to improve your LCP score, let’s consider the common LCP issues you might need to resolve:
- Slow-loading content due to geographical distances
- Oversized and under-optimized images
- Render blocking resources
- Relying on Client-Side Rendering (CSR)
Don’t worry, we’ll cover how to resolve each of these issues together next!
How to fix your LCP issues
So, now that we know all about LCP as well as how we can measure it on a website, it’s time we look at how to improve it. In this section are five methods you can use to decrease the LCP score of any website.
Use a CDN to deliver your content/website
CDNs or Content Delivery Networks are a great way to cut down on your website loading times. A CDN allows you to physically locate your website's files closer to your user by storing them on servers located around the world. Instead of having one server that supplies the entire world with your website, a CDN can store the same version of your website at different locations around the globe so people can then access your website from the closest server to them, allowing them to receive the files sooner.
But, CDNs aren’t just for the code and text that makes your website run. As you’ll see in the next section, CDNs can also be used for media like images and videos to help improve their loading times. Finally, if we’re being honest in 2023, with hosting services such as AWS, Vercel, and Netlify, there is no reason not to use a CDN since they come preconfigured on a lot of modern hosting services.
Optimize and compress images
A lot of websites include large images such as a hero image that displays to the user above the fold. Images like this are be therefore included in the LCP score and are something to pay particular attention to. If the images are too large or too high-quality, they could have a massive impact on your LCP score. You can avoid this by optimizing and compressing any images on our website, using optimized image types, and serving your images on a CDN.
At this point, you may be thinking that compressing your images will ruin their quality and they’ll look awful. And, at a certain point, you’d be correct, but it’s surprising how much you can compress an image without losing a noticeable amount of quality. Check out this interactive tool from Cloudinary to see what I mean. Experiment with different quality levels used in the compression and see the impact on file size as well as how much the image changes to see it in action.
Another option to optimize your images is to use the latest file formats, like WebP and AVIF. These newer file formats can retain higher levels of quality while still having low file sizes so where they can be used, they definitely should be. However, support for these file types in different browsers is still growing, so you should check that they’re supported enough for you before opting to use them.
But how can you compress your images or optimize them in other ways? The truth is this can be done in a variety of ways. The older, more manual way is to optimize your image before uploading it to your website using software such as Photoshop. But today, you can automate this process using image CDNs like Imgix.
Services like Imgix, handle all the compression, file conversions, and resizing of your images to make sure they’re always served as optimally as possible to your users including in the latest file formats like WebP and AVIF. Services like Imgix also utilize CDNs to ensure the images are located as close to the user as possible to cut down on loading times. Win-win! Some content management products, like Prismic, even automatically implement services like Imgix for you.
Remove any render-blocking resources
When your browser first receives an HTML file from a server and parses the DOM, it will fetch any external CSS or JavaScript files that are referenced in that DOM. These external files are render-blocking, meaning they stop the browser from parsing the remaining elements of the DOM while the files are being fetched. Once the files are downloaded, the browser can continue parsing other things, like that giant hero image. Therefore the external files delay the browser’s DOM rendering, which can cause a spike in your LCP. Let’s check out two ways to resolve this issue.
Inline Critical CSS and JS files
To improve your LCP, you can inline your critical CSS and JavaScript files directly into your HTML file. This means any code that is required for the page to load or function is already present in the HTML so no external files are required to display the page and the DOM parsing is never blocked while fetching external scripts.
How you inline CSS and JavaScript will largely depend on your tech choices and the architecture of your website. But, as an overview, you want to start by measuring which CSS and JavaScript files are causing your issues, with the Chrome DevTools and the Lighthouse auditing tab we mentioned earlier. You can find details about render-blocking files in your “Measuring LCP” score section.
Once you know which files are hurting your score and therefore need to be optimized, it’s time to get to work. But, this is unfortunately where it heavily depends on your tech stack. If you have direct access to the output HTML, you could manually inline the CSS and JS. But, if there’s a build process involved, then you may need to get a bit more creative! But, if you want a good example of how to do this optimization, then the people over at Google have a great post.
defer attribute
If you’re using external scripts and they’re not needed for the page to function then you can use the defer attribute in the script tag when referencing the script. This means that the browser can continue parsing the DOM and return at a later time to fetch and execute the file referenced in the script tag. And, because the DOM parsing isn’t paused, it means your LCP score doesn’t get hit.
<script src="/_next/static/chunks/polyfills.js" defer></script>Dig deeper to optimize your site
Preload resources
Browsers can’t always detect the elements that will be important to above-the-fold parts of a page and therefore should be loaded first. If a browser isn’t loading above-the-fold elements first, it’s usually because of how the elements have been implemented. For example, a hero background image that has been added via CSS is very important to your LCP score, but a browser won’t know the image exists (or its importance) until the CSS has been loaded and parsed. And, at that point, we’ve already lost precious time for our LCP.
We can help the browser prioritize important files like these by using a link tag inside the head tag of our HTML file with the rel="preload" attribute on it. Here’s an example from Google’s resources, where you can learn more about using this method:
<link rel="preload" as="image" href="important.png">This attribute, tells the browser to preload the file even without knowing where the file will be used in the DOM. So, in our example, when the browser does parse the CSS file and see where the image is being used, the image is already downloaded.
Avoid preloading too many resources
You should avoid preloading too many resources and should restrict using this method for only above-the-fold images, videos, and critical CSS or JavaScript files. Basically, only use it for anything that will impact the LCP and not much else.
Server-side rendering (SSR) / Static Site Generation (SSG)
Rendering is the process that composes all of your HTML, CSS, and Javascript into code for a web page that visitors can actually interact with.
There are a few different ways that a website can be rendered: client-side rendering (CSR), server-side rendering (SSR), and static site generation (SSG). WordPress, for example, renders websites with SSR by default, while a site built with React renders with CSR by default. Some technology stacks enable you to control your rendering strategy, and when that’s the case, the one you choose can have a big impact on your LCP.
The best options for LCP are server-side rendering or static site generation (though it’s important to note that each rendering option has its own drawbacks depending on your use case). But what does it mean to render your website with these options? How do they work?
The most important distinction between all of these rendering methods is that they each happen at a different place (server vs. browser) and moment (on-request vs. before the request) in the lifecycle of the website.
SSR
SSR means that your website is rendered on the server, which is a good thing because it leaves less work for the browser to do while it’s busy doing many other things. SSR also means that your website is rendered every single time a user visits your page (each time they “request” the page). So, behind the scenes, a visitor goes to a website, which triggers a request for a page. When that request reaches the server, the whole page is rendered and then returned to the browser. Then the browser does the work of translating the code into the visual interface the visitor wants.
SSR is much faster than client-side rendering, which is the default for many frameworks like React, where the browser is responsible for all of the rendering and all of the other work it needs to do to load files, translate the code, etc. When the work is divided between the server and the browser, things can load a lot faster.
SSG
SSG is where a page is rendered on the server ahead of time, before the user even requests a page. It’s a configuration where the page is rendered at “build” time and the outputted HTML is then stored and cached on a CDN, waiting for a user's request. Once the user requests it, they’re sent the cached HTML and the browser parses and displays it to the user.
SSG is even faster than SSR because the code is pre-rendered before a visitor makes a request, meaning that there’s no need to wait for the server to generate the page output, improving your LCP and your TTFB (Time to First Byte) scores even more.
Unfortunately, the rendering method you choose to use is often determined by your technology choice and use case. As mentioned before, default WordPress installations, for example, use SSR, and a standard React application uses CSR. But, this doesn’t mean you can’t combine technologies to get the maximum benefit of SSG. If your SEO has a significant impact on business outcomes, you might need to consider using a headless content management product with a technology like Next.js, so that you can implement SSG for the best LCP score possible.
Learn more about when to use different rendering methods
Closing Thoughts
LCP can be a complicated Core Web Vital to understand and optimize for. But, we can give ourselves and our websites a fighting chance by making sure we do as many of the best practices listed above as possible.
At the end of the day, LCP is just one of the Core Web Vitals used to score websites so it’s worth learning about the other vitals as well. An excellent place to start is our guide to Core Web Vitals in 2023.


